Gender pay gap

Gender pay update – 2026
We’re committed to providing equal opportunities across the whole of our team, regardless of age, gender, race or background. As part of this commitment, we’re pleased to present our gender pay report.
Our gender pay analysis is based on a snapshot of all Helping Hands’ employees who were paid in the 2025-26 period.
Employees at Helping Hands are made up of the following groups and departments:
- Executive Board of Directors
- Head office teams and departments
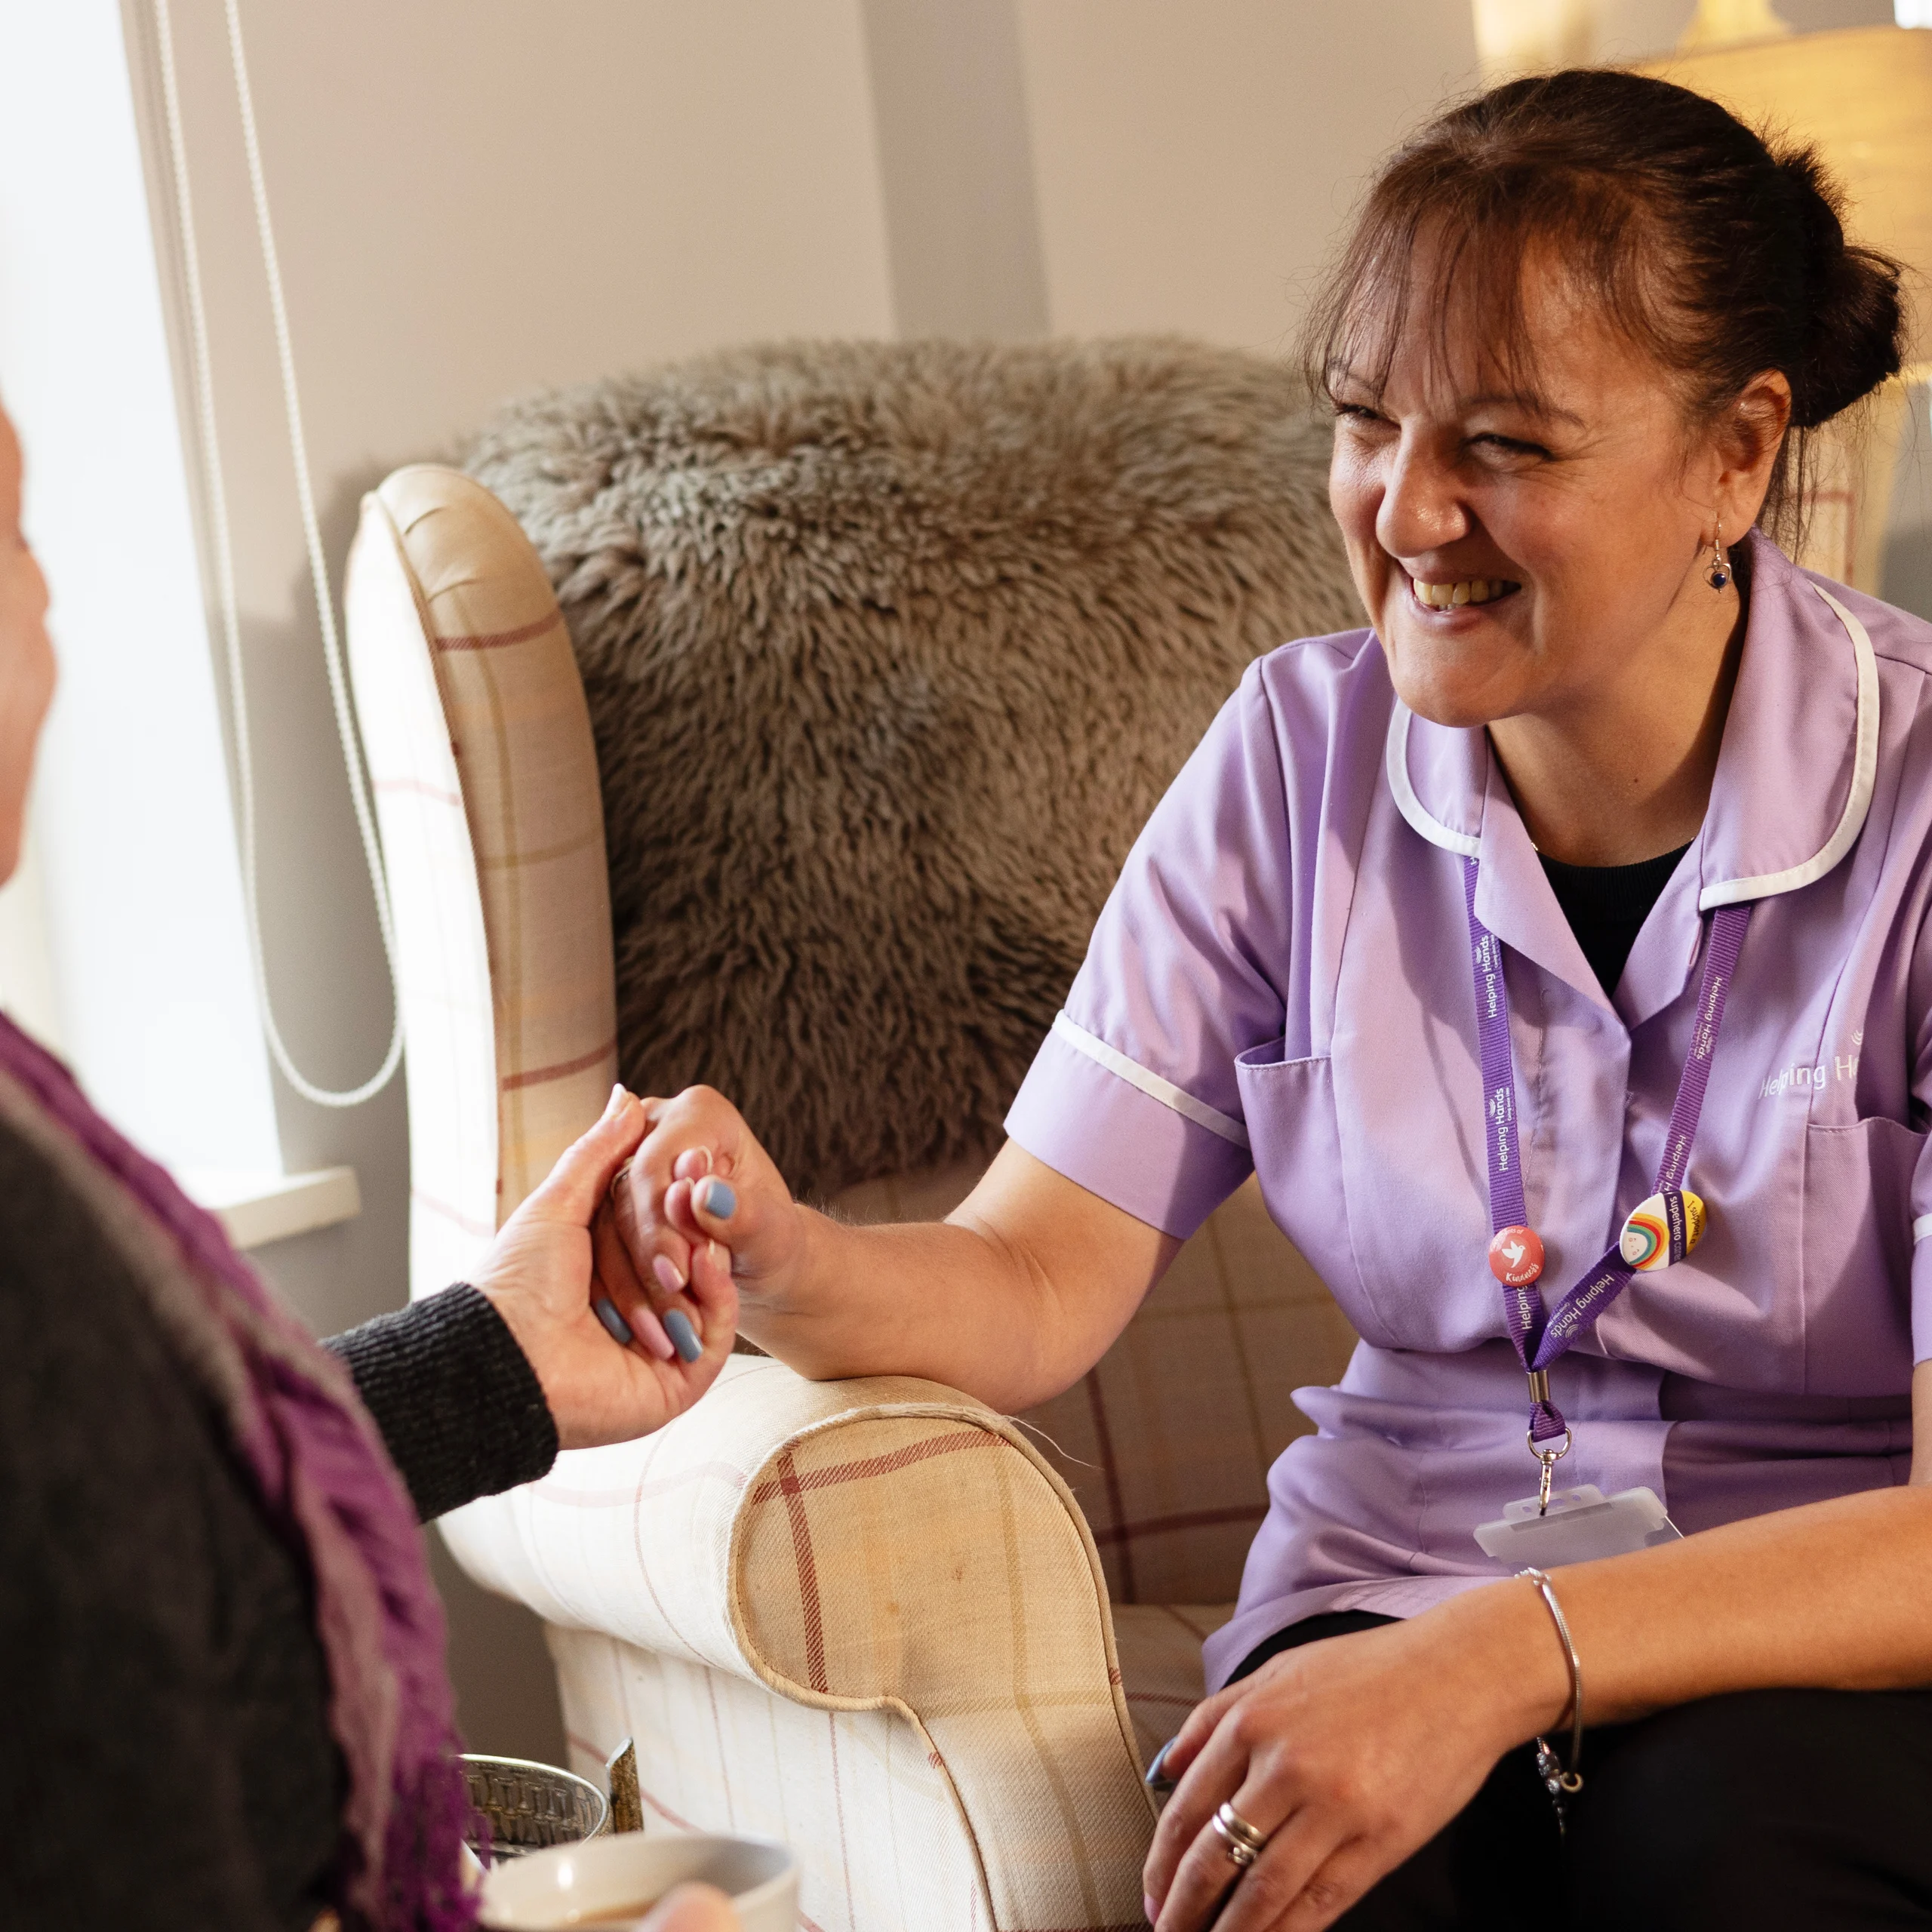
- Branches, including office-based teams and visiting carers
- Live-in carers
- Field-based operational teams

We place special importance on career development at Helping Hands, and there are many examples of people who have progressed their career with us – some who joined us as a carer and are now in a managerial or office-based role.
Pay quartiles
This table outlines the gender distribution at Helping Hands Home Care across four pay quartiles.
| Percentage of males and females in pay quartiles | |||||
|---|---|---|---|---|---|
| Lower | Lower mid | Upper mid | Upper | All employees | |
| Male | 11.4% | 9.1% | 10.1% | 11.3% | 10.5% |
| Female | 88.6% | 90.9% | 89.9% | 88.7% | 89.5% |
Gender pay gap
We have a minor gender pay gap at Helping Hands, which means that the average men’s gross hourly earnings are slightly higher than those for women. The only reason for this is men occupying fewer administrative positions than women. This gap is mainly because of our predominantly female workforce.
Pay gap
| Median (midpoint) | Mean (average) |
|---|---|
| No variation for female colleagues | 5.4% higher for male colleagues |
For all departments across the business, we do not differentiate on pay rates between male and female, and this is reflected at all levels of the organisation.
Bonus gap
We pay relatively few bonuses, with most of those that are paid going to operational managers, which are linked to quality, compliance and financial performance.
The difference between bonuses for our male and female employees, covering bonuses and commissions, are outlined below:
Percentage of colleagues receiving a bonus
| Male | Female |
|---|---|
| 6.2% | 4.0% |
Bonus gap
| Median (midpoint) | Mean (average) |
|---|---|
| -4.2% | 54.6% |
During the 2025/26 financial year, 237 bonuses were paid to 36 out of 584 male colleagues, compared with 201 out of 4,996 female colleagues.
I confirm that this data has been calculated according to the requirements of The Equality Act 2010 (Gender Pay Gap Information) Regulations 2017.
Siân McCrilley, Finance Director
April 2026
Other people are interested in…
We’re here to talk through the many job opportunities available here at Helping Hands. Call us on 03331224269 if you’d like to join our team.

Career development
Develop your career with Helping Hands

Our Leadership Team
What our team says
What our team says about Helping Hand